Is the Chesapeake Bay the Best It’s Ever Been?
The Chesapeake Bay scored a “C+” in the latest report card released by the University of Maryland Center for Environmental Sciences. It’s the best grade in 40 years, but there’s more to the story.
The Chesapeake Bay is on the mend. That’s the loudest message from the 2026 Chesapeake Bay and Watershed Report Card, which the University of Maryland Center for Environmental Sciences (UMCES) released on Tuesday. The annual report card measures the Bay’s health through a variety of water quality indicators and also assesses ecological, social, and economic factors across the broader Chesapeake region. In 40 years of tracking, this year’s C+ (which reflects conditions in 2025) is the highest grade awarded for Bay health overall. But the report’s wealth of finer-scale information whisper-shouts another message, too: Improvements are both uneven and unfinished. Here are some big takeaways.
1. Bay receives highest grade ever (but context matters)
First, the overall score. It was a 56%, or C+, the highest ever (Note: For those who would be shocked to get a C+ for scoring 56% on a test, UMCES essentially grades the Bay on a curve). A couple things are important to put that in context:
- If you were skeptical of our headline, you should be. The report card’s health scores stretch back to 1986. According to the factors the report card assesses, the Bay’s health is the best it’s been during that window of time. Formal restoration efforts kicked off in the 1980s precisely because the Bay’s condition was poor. No one is arguing the Bay is the best ever in history, or that it’s where it should be, but it has improved on the whole.
- A 56% is the highest score, but it’s not an astronomical departure from past scores. The Bay scored 55% in 2023, for example, and also in 2002. In 2016 and 2017, it scored 54%. That being said, it is much higher than the low points measured in 2003 (36%) and 1996 (39%).
- Drier weather in 2025 helped the score. In any given year, weather patterns affect how well rivers and the Bay are doing. Less rain means less polluted runoff washed into waterways. However, the report noted that the improvement could not be explained by weather alone—restoration efforts also got credit.
- Keep in mind what the score measures (and doesn’t): Overall Bay health encompasses seven indicators of water quality, including levels of phosphorus, nitrogen, and oxygen in the water, water clarity and algae growth, and the condition of underwater grasses and small animals that live on the bottom. These are important for supporting life in the Bay, but they are not a direct reflection of how fish, birds, and other wildlife are faring.
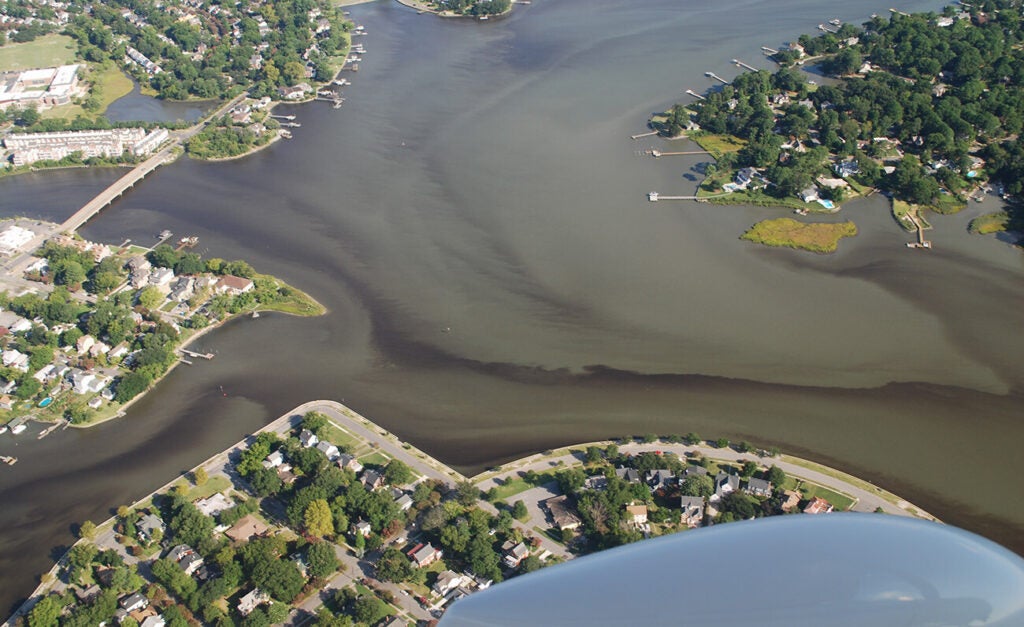 Christy Everett/CBF Staff
2. Improvements are uneven across rivers and regions
One of the most unique and useful features of the UMCES report card is its breakdown of health across different rivers and regions of the Chesapeake Bay. This year it also included a breakdown of water quality trends across areas upstream of the Bay, too. The report’s accompanying online dashboard is a great tool for exploring the region’s individual scores and trends over time, but these are a few big points:
- Grades showed wide variation. The Bay’s overall score masks some areas that are doing really well and others that are doing poorly. In the Bay itself, the Lower Bay (which covers the mainstem of the Bay roughly south of the Rappahannock River to the mouth) achieved a B+, the highest grade on record for any region. But the Lower Western Shore of Maryland (encompassing rivers near Annapolis such as the Severn, South, and Rhode) earned a D-, the lowest score. (See the full report card for all regional scores).
- Over time, most areas are improving. More than half of the areas assessed in the Bay itself (eight out of 15) are getting healthier over time, while the rest are holding steady. Of the 23 upstream areas assessed, 10 are improving over time and two are declining, while the rest showed no trend or didn’t have enough data.
- Notable trouble spots remain.
- In Maryland, they include: The Patuxent River and the Patapsco and Back rivers, which received D grades. As noted above, the Lower Western Shore received the lowest score of any region, a D-. And though it earned a C this year, water quality is getting worse over time in the Lower Eastern Shore watershed.
- In Pennsylvania, the Lower Susquehanna watershed earned a D+, the lowest of all the upstream areas scored, and water quality trends there are not showing improvement over time.
- In Virginia, the York River earned a D and the Elizabeth River earned a D+. While the James River itself earned a C+, water quality in the lower portion of its watershed is trending worse over time.
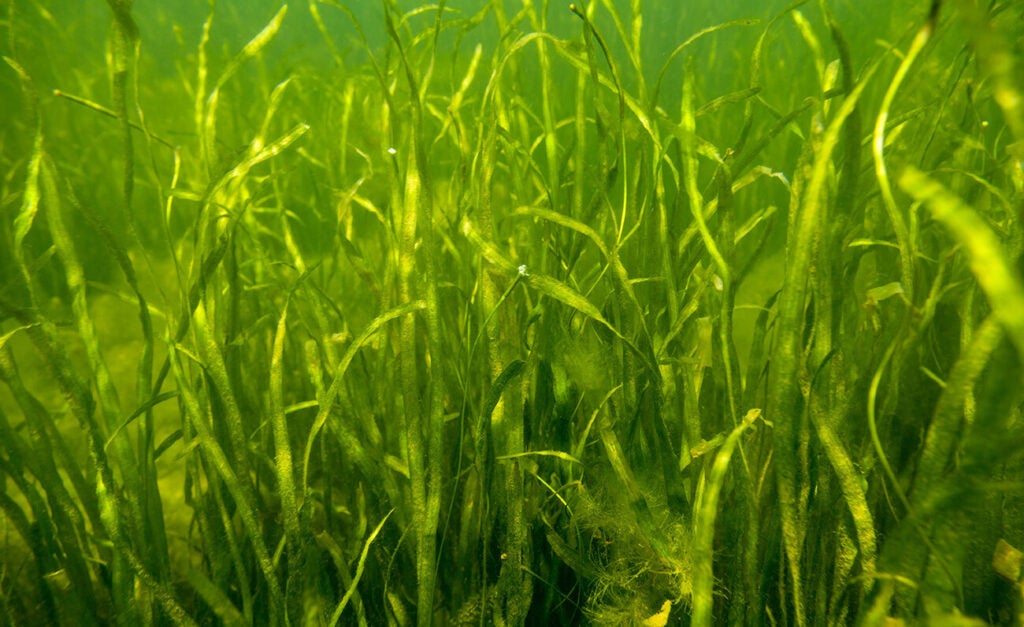 Will Parson/Chesapeake Bay Program
3. Conditions are (mostly) moving in the right direction.
In addition to a regional breakdown of results, the report card also examines how different indicators of health are changing.
- What’s improving: Within the seven indicators of Bay health, four are significantly improving over time, including dissolved oxygen, levels of phosphorus and nitrogen, and the extent of underwater grasses. The first is a basic necessity for life to survive in the water. The second two are measures of pollution that can drive harmful algal blooms. The third provides shelter and food for many fish and wildlife. All are getting better.
- What’s getting worse: Two of the seven indicators are declining over time—water clarity and chlorophyll a (which measures how much algae is in the water). In other words, the water is cloudier.
 Joel Boches
4. Is the Bay saved yet? No.
At the end of the day, a 56% is still a 56%….out of 100%. It may be the highest the Bay has achieved so far, but it’s not the end goal.
- For one, states and the federal government still aren’t meeting goals to reduce pollution. They also recently signed an updated set of commitments to improve other Bay resources, beyond water quality. This includes things like restoring more oyster reefs, protecting forests that are critical for clean water, and creating more opportunities for public access.
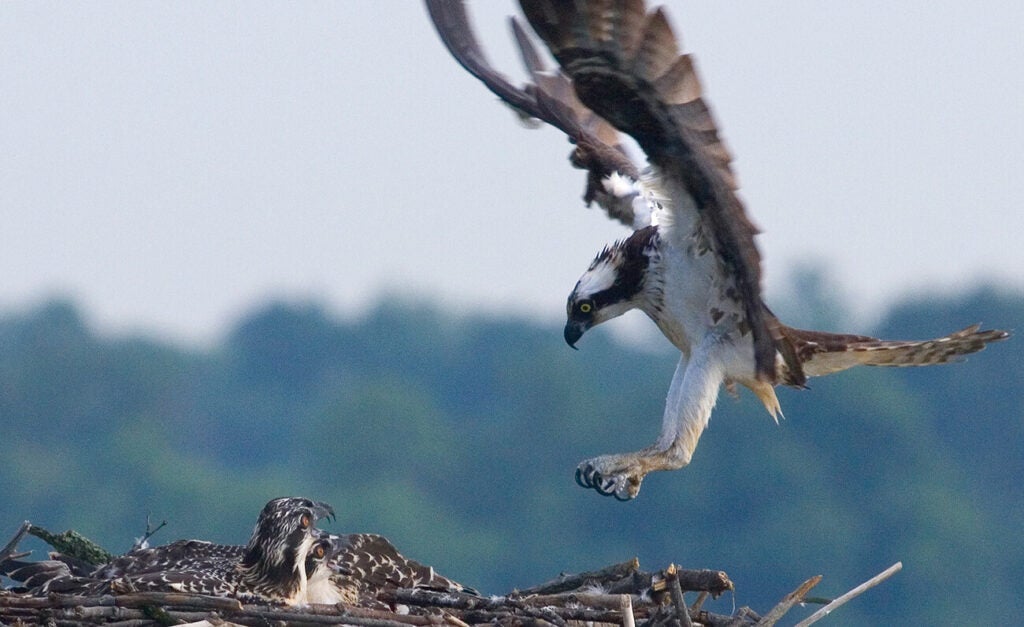
- Second, fish and wildlife in the Bay are still struggling. For example, there are ongoing concerns about species like striped bass, menhaden, and osprey. Climate change, development, and population growth are still challenges.
- That being said, it’s a moment of cautious optimism. The report attributed this year’s high score to a combination of ongoing restoration efforts and the relatively dry weather in 2025 that washed less pollution into the Bay.
Bottom line, as CBF President and CEO Hilary Harp Falk puts it in CBF’s statement on the report card: “This offers a glimpse of what a healthier Chesapeake can look like when less pollution reaches our waters. But a C+ is not a final grade. One good report card doesn’t mean the job is finished. Together, we still have a lot of work to do.”
Related Stories
-
 Blog Story
As Summer Heats Up, Vibrio Comes Into Focus for the Bay
As climate change helps drive longer-term increases in water temperatures in the Bay, cases of Vibrio vulnificus—a rare, “flesh-eating” bacteria that thrives in brackish or salty waters—have been increasing in Maryland and Virginia in recent years as well.
-
 Blog Story
The Potomac Challenge
The sewage spill in our nation’s capital should be a wake-up call across the country. As the United States celebrates 250 years, we must ask how we’re leaving our waterways for future generations.
