Maryland's Clean Water Blueprint is the state's plan to reach pollution reduction goals for improving water quality in the Chesapeake Bay by 2025. Also known as the Watershed Implementation Plan (or WIP), it represents a major milestone for state planning toward achieving ambitious clean water goals in parallel with other Bay watershed states. If fully implemented, it will vastly improve the health of rivers, streams, and the Chesapeake Bay.
In December 2010—after years of missed deadlines for cleaning up the Chesapeake Bay—the Environmental Protection Agency (EPA) released science-based pollution limits (technically known as the Total Maximum Daily Load or TMDL) for nitrogen, phosphorus, and sediment pollution in the Bay. Subsequently, the six Bay states and the District of Columbia released initial WIPS to meet those limits by 2025. This collaborative effort between federal and state governments is commonly referred to as the Chesapeake Clean Water Blueprint.
Maryland filed the final version of its Phase III WIP with EPA on August 23, 2019. Phase III of the Blueprint provides a path to keep the state on track to reduce nitrogen pollution entering the Bay to 45.8 million pounds per year and phosphorus to 3.68 million pounds per year. To put those numbers in perspective, the state estimated that in 1985 about 77 million pounds of nitrogen and 5.4 million pounds of phosphorous flowed into the Bay. Because phosphorous enters the bay by attaching itself to sediment, the state's focus on phosphorus reduction is also expected to reduce sediment. For more details, read our blog post, "5 Things to Know about Maryland's Clean Water Blueprint."
The Blueprint Is Working
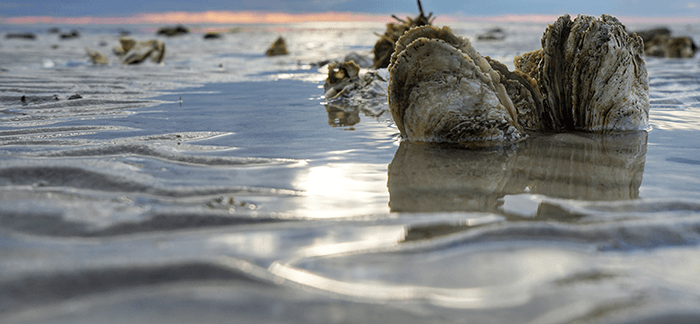
Maryland has consistently reduced nutrient pollution loads since 1985 and that progress has changed the landscape of the Bay. There are more forest buffers lining streams, bay grasses are increasing, oyster restoration projects are underway, and oxygen-deprived dead zones have shrunk.
From 2009 to 2017 Maryland reduced nitrogen loads by about 3.3 million pounds and phosphorous loads by 380,000 pounds. Already, the state is on track to reduce the annual amount of phosphorous and sediment that enters the Bay to below the 2025 goals. This last phase of the Blueprint aims to continue the progress on phosphorous reduction while also achieving the nitrogen reduction goal.
We Need to Finish the Job
Despite the advancement, the recovery remains fragile. Climate change is bringing more frequent, heavier storms throughout the watershed and 2018 was the rainiest year in Maryland's history. The influx of fresh water is reducing salinity in parts of the Bay, raising questions about the future for oysters and other marine life that depend on salty water. Continued development in urban and suburban areas also threatens to add new pollution loads that must be addressed in the future.
That's why now it's critical for Maryland and the other states to continue making progress to achieve the goals of the Chesapeake Bay Clean Water Blueprint. Doing so will result in better water quality, cleaner air, a more vibrant seafood industry, increased recreational opportunities, and more beautiful communities.
For more details, go to Maryland's Bay Cleanup Plan website or read the draft Blueprint.
| Nitrogen | Phosphorus | |||||
|---|---|---|---|---|---|---|
| MDMaryland | ||||||
| Agriculture |
||||||
| U&S Polluted Runoff† |
||||||
| Septic |
N/A* | |||||
| Wastewater & CSO† † |
||||||
| TOTAL |
||||||
| red | projected loads more than 20% off target or pollution is increasing |
| yellow | projected loads within 10-20% of target |
| green | projected loads within 10% of target |
| * | No contribution from this source sector |
| † | Urban & Suburban |
| † † | Combined Sewer Outflow |
For our 2019 evaluation of Maryland's progress on its milestone commitments, see Maryland's Blueprint for Clean Water.
Join Us Today!
Join our Action Network and we'll keep you informed of key issues and steps you can take to save the Bay.